Post by Lil-man-ballThe sun shines down on the Earth with life-giving light that looks
yellow and white as it crosses the sky, but one day that will
change. Dust, gas, and plasma will begin to accumulate in the sun’s
atmosphere, causing a dimming to a reddish hue. When the sun
darkens almost black from accumulation, the light and solar plasma
cannot escape, and the energetic pressure inside the solar
atmosphere grows. The pressure eventually overcomes the outer
shell, erupting in a micronova. The initial eruption will produce a
bright flash of visible, UV and x-ray light, which may thermally
and energetically destroy parts of the biosphere. This is the
burning aspect described by the Buddhist Sermon of the Seven Sons.
This phase will not last for very long, a few minutes at most or
even possibly just a few seconds. For the next 4-20 hours (until
the micronova shockwave arrives at Earth), energetic protons and
electrons will be bombarding the upper atmosphere, delivering an
incredible excess of electricity. Ambient atmospheric electricity,
telluric currents, and atmospheric pressure cells connected to the
global electric circuit will all be amplified. When the shockwave
arrives, it will be a long impact, hours to days to even weeks. At
first the shockwave will be comprised mostly of plasma, accelerated
to high speeds, which would induce electrical disruptions on Earth
that would destroy every power grid, create more-unstable
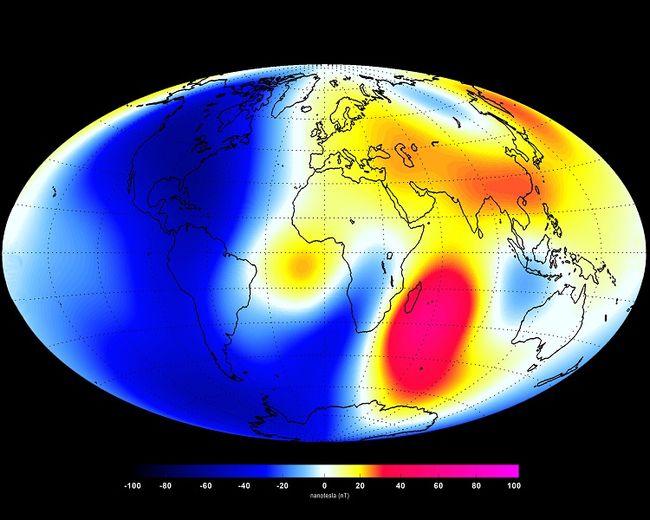
atmospheric electricity conditions, and could even cause a
sun-facing magnetic field collapse, bringing an arc discharge
(similar to a magnetar burst) from the sky to the ground
(pictured). It will also begin to bring the isotopes of the nova.
The bombardment will transition from plasma to dust and other
molecules as the second component of the wave arrives, which will
have the isotopes of heavy elements in the nova attached to the
dust, and which will present itself in vastly non-homogenous ways.
If you are facing the sun when the plasma arrives, it may be
nighttime when the dust and heavier components hit. The turning of
the Earth through the phases of the shockwave impact means that the
isotope distribution is different across the globe. This is missed
in all dating techniques. At this point, the dust begins to block
out the sky, and it lingers in the inner solar system while the
larger pieces of the shell arrive- the impactors. Silicate material
like glass and congealed/cooled plasma and dust that have
agglomerated in the shell expansion will arrive at the end of the
shockwave, and the bombardment here likely plays a key role in how
bad of a disaster the Earth actually faces. If larger pieces hit
the Earth, it could turn a bad event into a cataclysm.
5.1 What is the Solar Micronova?
Disaster (noun): Combination of dis (ill, negative, pejorative) and
aster (star). The sun shines down on the Earth with life-giving
light that looks yellow and white as it crosses the sky, but one
day that will change. Dust, gas, and plasma will begin to
accumulate in the sun’s atmosphere, causing a dimming to a reddish
hue. When the sun darkens almost black from accumulation, the light
and solar plasma cannot escape, and the energetic pressure inside
the solar atmosphere grows. The pressure eventually overcomes the
outer shell, erupting in a micronova. The initial eruption will
produce a bright flash of visible, UV and x-ray light, which may
thermally and energetically destroy parts of the biosphere. This is
the burning aspect described by the Buddhist Sermon of the Seven
Sons. This phase will not last for very long, a few minutes at most
or even possibly just a few seconds. For the next 4-20 hours (until
the micronova shockwave arrives at Earth), energetic protons and
electrons will be bombarding the upper atmosphere, delivering an
incredible excess of electricity. Ambient atmospheric electricity,
telluric currents, and atmospheric pressure cells connected to the
global electric circuit will all be amplified. When the shockwave
arrives, it will be a long impact, hours to days to even weeks. At
first the shockwave will be comprised mostly of plasma, accelerated
to high speeds, which
would induce electrical disruptions on Earth that would destroy
every power grid, create more-unstable atmospheric electricity
conditions, and could even cause a sun-facing magnetic field
collapse, bringing an arc discharge (similar to a magnetar burst)
from the sky to the ground (pictured). It will also begin to bring
the isotopes of the nova. The bombardment will transition from
plasma to dust and other molecules as the second component of the
wave arrives, which will have the isotopes of heavy elements in the
nova attached to the dust, and which will present itself in vastly
non-homogenous ways. If you are facing the sun when the plasma
arrives, it may be nighttime when the dust and heavier components
hit. The turning of the Earth through the phases of the shockwave
impact means that the isotope distribution is different across the
globe. This is missed in all dating techniques. At this point, the
dust begins to block out the sky, and it lingers in the inner solar
system while the larger pieces of the shell arrive- the impactors.
Silicate material like glass and congealed/cooled plasma and dust
that have agglomerated in the shell expansion will arrive at the
end of the shockwave, and the bombardment here likely plays a key
role in how bad of a disaster the Earth actually faces. If larger
pieces hit the Earth, it could turn a bad event into a cataclysm.